1、 The formation principle of eye chart
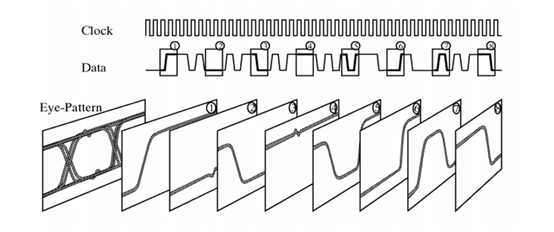
When observing the transmitted data signal with the oscilloscope, the tested system's timing signal is used to control the scanning of the oscilloscope through an external trigger or external synchronization. Since the scanning period is just an integral multiple of the tested signal period, what is observed on the fluorescent screen of the oscilloscope is a stable figure formed by multiple random symbol waveforms. This kind of model looks like the eye, which is called a digital signal's eye chart. A complete eye chart should contain all-state groups from "000" to "111". The process of eye chart formation in 8 states is shown in the following figure:
Generally, the oscilloscope signal is the waveform of some bits or a certain period, reflecting detailed information. Simultaneously, the eye chart is a series of figures accumulated and displayed on the oscilloscope, which contains rich information. From the eye chart, we can observe the influence of code crosstalk and noise, reflecting the digital signal's overall characteristics to estimate the quality of the system. Provide the basis for improving the performance of the whole system.
2、The structure and parameters of eye map
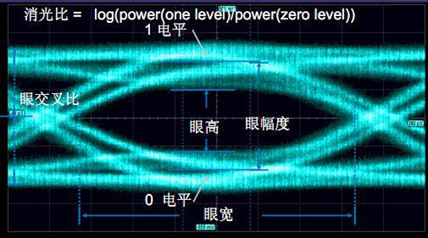
There are many parameters of eye map, such as eye height, eye width, eye amplitude, eye cross-ratio, extinction ratio, Q factor, average power, etc. each parameter is shown in the following figure:
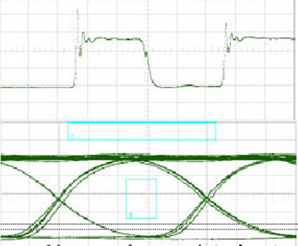
"Eye amplitude" refers to the difference between the average number of "1" level signal distribution and "0" level signal distribution, which is measured by distributing the amplitude value in the area near the central position of the eye map (usually 20% of the distance between zero-crossing time).
" Eye width" reflects the total jitter of the signal, that is, the size of the eye chart on the horizontal axis, which is defined as the time difference between the intersection points of the two upper and lower edges.
"Eye height" is the size of an eye image on the vertical axis. It is a signal-to-noise ratio measurement, which is very similar to the amplitude of an eye image.
Following details some complex concepts such as extinction ratio to help understand the eye map's performance.
(1) extinction ratio
The extinction ratio is defined as the value of the "1" level to "0" group in the eye chart. According to a different speed, different transmission distance, and additional laser types, the extinction ratio requirements are other. Generally, the extinction ratio of FP / DFB direct modulated laser should be no less than 8.2db. The extinction ratio of EML is not less than 10dB.no maximum value of extinction ratio in ITU-T, but this does not mean that the extinction ratio can be infinite. The extinction ratio is too high, which will cause the chirp coefficient of the laser to be too large, lead to the channel cost exceeding the standard, and is not conducive to long-distance transmission. Generally, it is recommended that the actual extinction ratio be 0.5 ~ 1.5dB larger than the minimum requirement. Not an absolute value. We give such a matter because we are afraid that the extinction ratio is too high. The signal degradation is too severe after transmission, resulting in an error code or the channel cost exceeding the standard
(2) Eye crossing ratio
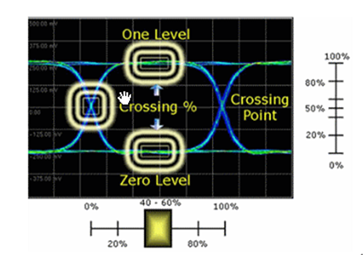
The intersection is where two eyes cross. Its proportion reflects the duty cycle of the signal. In the transmission process, that optical signal's pulse width will be widened, resulting in the intersection of the receiving side moving up relative to the transmitting side. To facilitate long-distance transmission and ensure that the proportion of cross points on the receiving side is about 50% so that the receiving side's sensitivity is the best, we generally recommend that the cross point's position be slightly moved down the sending side. The proportion of cross points on the sending side is usually recommended to be controlled at 40% ~ 45%.
(3) Q factor
Q factor can be measured by an oscilloscope, which reflects the quality problem of the eye chart. The higher the Q factor, the better the quality of the eye map. The q factor is generally affected by noise, optical power, and whether the electrical signal is impedance matched from the beginning to the end (impedance matching will be explained later). Generally speaking, the thinner and smoother the line of the "1" level in the eye chart, the higher the Q factor. In the case of no light attenuation, the Q factor of the transmitted side photo eye should not be less than 12; the higher, the better. The q factor of receiving the test should not be less than 6; higher is better.
(4) Rise time and fall time of signal
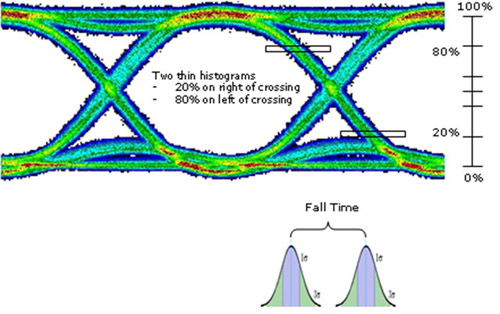
The rise time and fall time of the signal reflect the speed of the movement's rise and fall, which generally refers to the change time of 20% - 80% of the absolute signal amplitude. Generally, it is required that the rise and fall time shall not be greater than 40% of the signal cycle. For example, the 9.95g signal requires that its rise and fall time not be greater than 40PS.
(5) Shake
Jitter is a timing noise that causes error in high-speed data transmission lines. If the system's data rate increases, the jitter amplitude measured in a few seconds will be almost the same. Still, when measured in a fraction of the bit period, it will increase proportionally with the data rate, resulting in an error code. Therefore, in the system, the correlation jitter is reduced as much as possible, and the system's overall performance is improved. The jitter analysis and its specific causes will help minimize the impact of jitter as much as possible in the system design. At the same time, it can determine the effect of jitter on BER and ensure that the BER of the system is lower than a particular maximum value usually. Therefore, the causes of jitter are directly shown in the following figure:
(6) Signal-to-noise ratio
Signal to noise ratio can also qualitatively reflect the quality of the movement as a comparative reference. The larger the measurement value is, the better. Generally, the measurement value on the transmission side is greater than 30dB. A spectrum analyzer is required for quantitative measurement.
3、 Eye chart and system performance
After research and experiment, we can get the performance of the whole system from the eye chart. Here we give the following conclusions combined with the eye chart framework.

图:眼图的结构图
(1) the best sampling time should be the time when the "eyes" open the most;
(2) the slope of the squint determines the sensitivity of the system to sampling timing error;
(3) the vertical height of the shadow area of the eye image indicates the distortion range of the signal;
(4) the position of the horizontal axis in the center of the eye map corresponds to the decision threshold level;
(5) the zero-crossing distortion is the length of shadow pressed on the horizontal axis. The timing standard of some receivers is determined by the average position of the decision threshold. The larger the zero-crossing distortion is, the more disadvantageous it is to extract the timing standard.
(6) half of the distance between the upper and lower shadow areas at the sampling time is the noise tolerance. If the instantaneous noise value exceeds it, a wrong judgment may occur.
4、Eye chart and bit error rate
In the digital circuit system, the sender sends out multiple bits of data. Due to many factors, the receiver may receive some wrong bits (i.e., error code). The number of error bits to the total number of bits is called bit error rate, or BER for short. The bit error rate is the most important parameter to describe the performance of a digital circuit system. In the communication circuit system of GHz bit rate (such as fiber channel, PCIe, SONET, SATA), BER is usually required to be less than or equal to 10-12. When the bit error rate is large, the communication system's efficiency is low, and the performance is not stable. The factors that affect the bit error rate include jitter, noise, channel loss, signal bit rate, etc.
In BER Test, the code generator will generate billions of data bits, send them to the input device, and then receive them at the output. The error code analyzer will then compare the received data with the transmitted original data bit by bit to determine which codes receive errors and then give the BER calculated in a period. Considering the need for a bit error rate test, we take the following actual test eye chart as a reference to generate BER chart, and the reference eye chart is as follows:

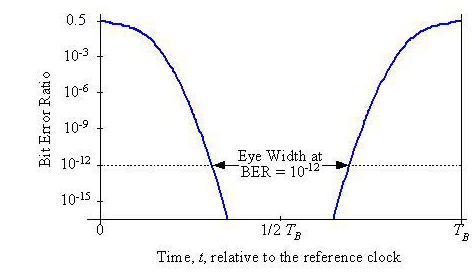
BER chart is a function of the time position BER (T) of the sample point called Bert scan chart or bathtub curve. In short, it is the BER measured at different times t relative to the rated sampling time given by the reference clock. The reference clock may be a signal transmitter clock or a clock recovered from the received signal, depending on the tested system. With the above eye chart as a reference, the relationship between eye-opening and bit error rate and the BER chart are as follows:
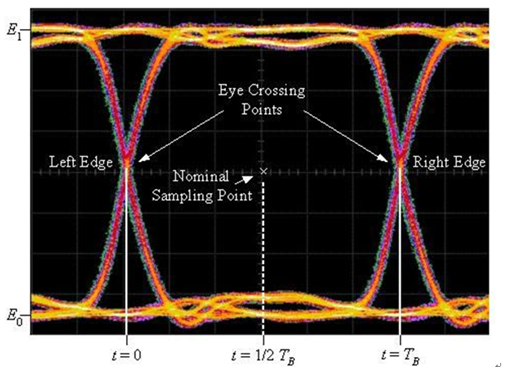
图 眼睛张开度与误码率的关系
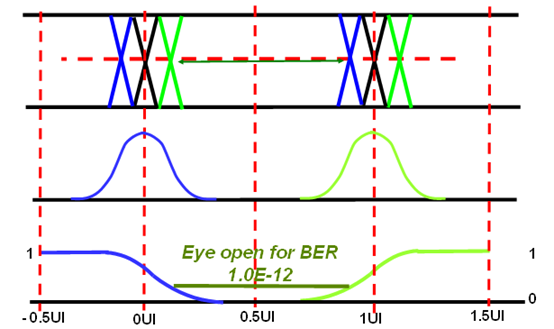
图 BER(T)扫描或浴缸曲线
In the above two graphs, the BER graph and eye graph have the same time axis, two sides correspond to the edge of the eye graph, and the sample point is in the center. When BER is fixed, the distance between the curves is eye-opening on the BER. When the sample points are close to the intersection, jitter will cause BER to increase to the maximum of 0.5.
5、 Common eye chart analysis
Next, let's take a look at some typical good eye maps and some problematic eye maps and analyze these eye maps' problems.
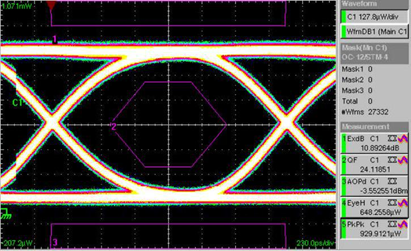
The following is a better 622M eye diagram. We can see that it is symmetrical, the liner is fine, the extinction ratio is moderate, and the Q factor is very high, reaching 24.
.
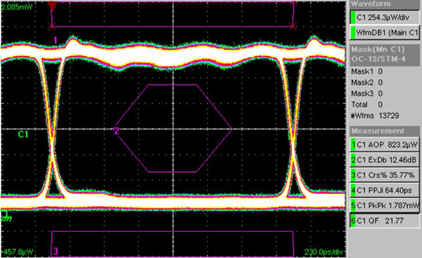
The following is a 622 eye diagram without an STM-4 filter. The eyeliner is thinner, especially the rising and falling edges. The "1" level fluctuates a little. Because the harmonics of the signal are not filtered out after the low-pass filter is applied, and all the harmonic components are stacked up to become a square wave with wave patterns. We see that even if the "1" level is not flat, its Q factor is still 21.7.
The following is a better 2.5G, the eye diagram is symmetrical, the eyeliner is relatively thin, the "0" and "1" levels are smoother, the extinction ratio is moderate, and the Q factor is higher.
The following is a useful 10g eye chart, which is symmetrical and thin, especially the level of "0" and "1"; the rising and falling edge is a little thicker, the jitter of the visible signal is more considerable; the extinction ratio is moderate, and the Q factor is higher. The intersection is slightly higher. In the actual debugging, you can lower the corner a little bit.
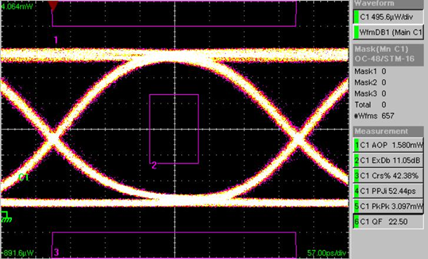
In general, the higher the speed, the worse the quality of the eye image. Two aspects mainly cause this: the first is jitter; the higher the rate, the more difficult the jitter is to control; the second is noise because the test process generally needs to add the corresponding low-pass filter, the bandwidth of the low-pass filter of 10G signal is about 8GHz, the bandwidth of the low-pass filter of 622m password is about 500MHz, and the noise in the frequency range of 500MHz ~ 8GHz is filtered by 622m signal The filter is filtered out, but the filter of 10G signal does not filter it out, so from the eye chart, the noise of 10G signal is more excellent.
Eye chart analysis with problems
Here is a 622m eye chart with problems. There are many problems with this eye chart. Let's analyze one by one: first, the eye chart has two apparent rising and falling edges (commonly known as double eyelid); level "0" is "1."
The level is not flat, and the signal has overshoot and undershoot; the extinction ratio is only 4.1db; it is suspected that the cause of these phenomena is the movement's impedance mismatch, which leads to overshoot, undershoot, and multipath of the signal. This eye chart also shows another problem. It is only the essential requirement of the eye chart, not the only requirement, to cover the template. Let's see that there is a certain margin between the edge of the eye image and the template.
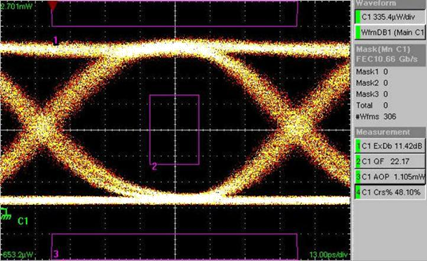
Let's take a look at the 622m eye chart below. The problem is that the noise is tremendous. It is estimated that the signal filtering is not well processed.
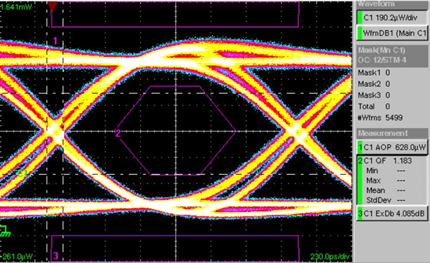
The following is the 2.5G eye chart. The overall quality is not bad. The problem is that the eye chart is a little crooked and asymmetric, which is related to the laser's modulation characteristics.
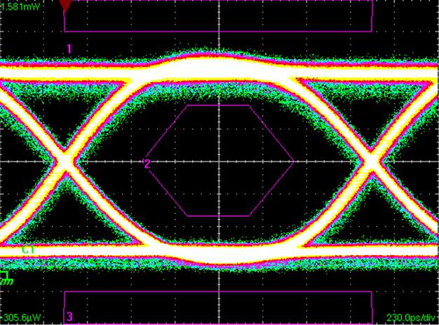
In the following 2.5G eye chart, the problem is that the jitter is large. Note that compared with the previous eye chart, the rising and falling edges are thick, especially the peak jitter, root mean square jitter, and the figure below is larger than the model above.
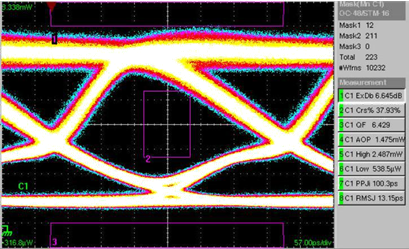
The eye chart of 2.5G below is worse. The eye chart twists and turns, rises and falls slowly, and the signal quality is poor. The Q factor is only 6.4. The extinction ratio is also very low, only 6.6db. The cause may be a problem with the driver, the laser itself, or a very mismatched impedance.
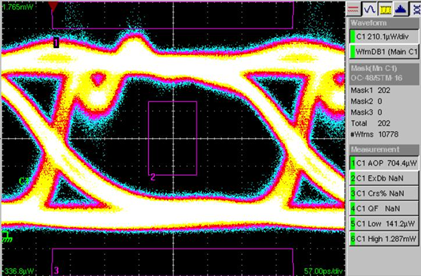
The following is a 2.5G eye diagram. It can be seen clearly that there are ringing at the rising edge of the eye diagram, which may be caused by two reasons: the first is the impedance mismatch above the signal line; the second is the ringing caused by the relaxation oscillation of the direct modulation laser.
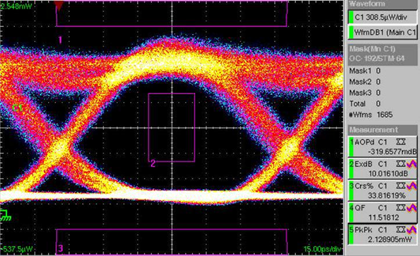
The following is a 10g eye map. There are two problems with the eye map. The first extinction ratio is too low, only 10dB. Eye chart "1" level is very rough and uneven. Possible cause: signal mismatch.
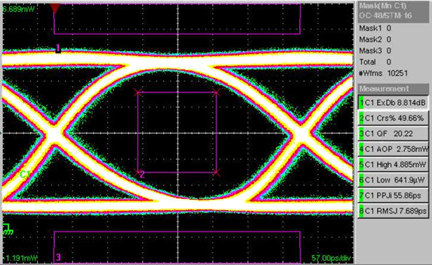
The following 10g eye map has no measurement data from the rough rising and falling edge of the eye map that the signal jitter is relatively large.
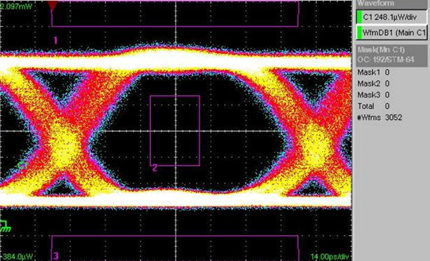
The following is a 10g eye map. The problem with this eye map is that the noise is relatively large. Where can we see it? Please note that the eye map's rise and fall and the "1" level are relatively thick, and the whole eye map has many scattered points, which is very unclean?
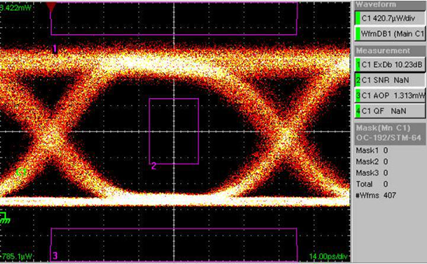
In the above three eye patterns, we analyze three situations that lead to lousy eye patterns: impedance mismatch, jitter, and noise. How can these three situations be seen from the eye chart? If the "1" level line of an eye chart is thick and uneven (above), it is caused by impedance mismatch. To solve the problem, we should guarantee the impedance matching from the beginning to the end. If the rising and falling edge of the eye chart is relatively thick (in the middle), it is caused by jitter. To solve the problem, we should reduce signal jitter, such as improving the quality of the input clock, reasonably designing the phase-locked loop, especially the low-pass filter. If the eye chart is thick (all), it is caused by noise. Generally speaking, it is caused by power noise, imperfect ground circuits, or large interference sources around the signal. To solve the problem, we should start from these aspects.
For the eye chart, to measured with a ruler. The higher the speed is, the more difficult the eye chart quality is to be guaranteed. The longer the target transmission distance is, the better the required eye chart quality is. Simultaneously, the eye chart quality of the optical module with data and clock input is better than that of the optical module with only data input, especially in the aspect of jitter.


